The Camel Back Curve:
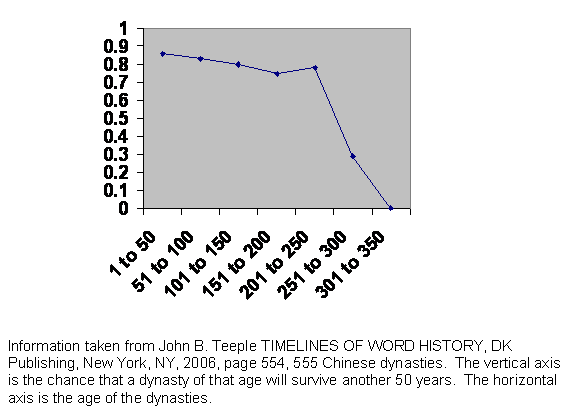
If we look once again at the curve of the survival of Chinese dynasties:
Experience of the survival of Chinese dynasties.

we see as I have repeatedly pointed out that the dynasties all seem to die out when they reach about 300 years of age. That is what the program predicts and what seems to be consistent with everything else. Call it about 10 generations. But if you look at the history of immigrant fertility, and I don’t have good numbers on this, only my own experience talking with people and undocumented remarks I have skimmed over, you notice that fertility seems to crash over three or four generations, maybe five. One might fudge a generation or two, and indeed a scientific theory that is off by only a factor of about two when there is no competitor in the field is scientific truth by default. Yet this factor of about two made me squirm for years.
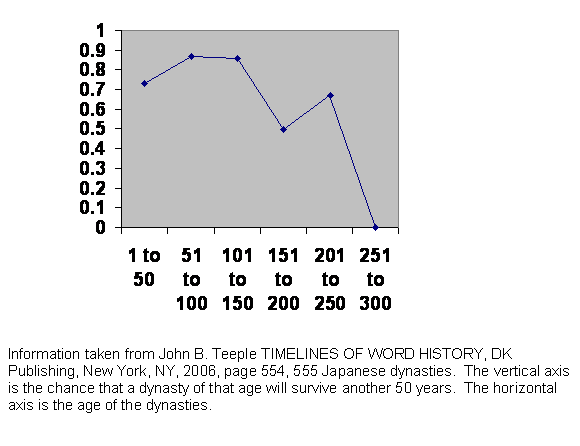
But if you look back at the graph at about 150 to 200 years, there is a bit of a notch. A few more dynasties, in terms of percentage, dropped out about that age than those a half century younger or older. Let us look at Japan again:
Experience of survival of Japanese dynasties.

It is easy to explain the rise in ability to survive over the first fifty years: powerful families had to be convinced that the new dynasty was legitimate. That could easily have taken a generation or two. And the death plunge as we approach 300 years is the same we all know and dread.
And there is that notch happening at the same time. Somewhere between 150 and 200 years, a trifle more than half the way through maximum career, the dynasties have a lowered survivability, a crisis.
Of course it could just be a fluke, a coincidence, yes, but still arguably a fluke. The numbers are small and the statistics not impressive.
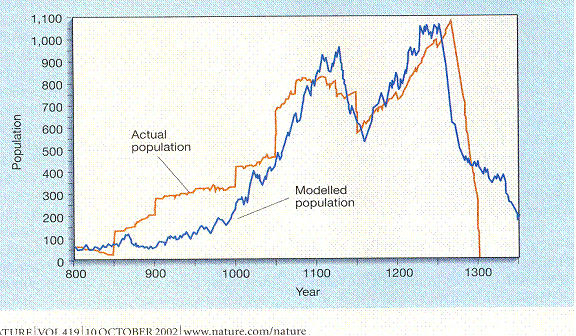
Then we look at the Anasazi of Longhouse Valley again:

Jared M. Diamond, “Life with the Artificial Anasazi,” NATURE, vol 419 no 6907, October 10, 2002 p 567.
This shows the relationship between the “actual population,” actually simply a number that has been reached by multiplying the number of occupied dwellings by some constant, and the “modeled population,” actually simply a number that has been reached by multiplying tree right width by some constant, on an annual basis. In other words: occupied houses in red, tree ring width is blue. The two are related, and this time there is no gainsaying the statistics. This one is real.
Notice that from the time the population begins its rapid rise to the time it dies out is about 300 years, from 1000 to 1300. So far, so good. Notice that there is a big jump in population, presumably people moving in, at about 900 from which time the trees start growing faster. They are cultivating the trees somehow. And population cannot be limited by the weather with the weather responsible for the growth rate because at that point the population is far above what the weather limited growth rate could support. So the growth rate follows the population size and the energy put into cultivation and we shall ignore the tree rings.
So there is the notch. And it’s a big one. Somehow there is a genetic cause to the rise and fall – as we already believe – and the population goes through two cycles surviving the first but not the second. And this is characteristic of human populations throughout the world and throughout history. If our computer program is good, then we should be able to model the same thing. We should be able to say that usually the population undergoes two cycles.
So I went back to the C language program and started tweaking. I thought maybe it had to do with recombination. That’s where chromosomes break and swap pieces. At a high recombination rate fertility is depressed just as it is if the mutation rate is increased. If the time scale of the recombination rate is different from the time scale of the mutations, maybe their effects reinforce each other on the second cycle.
Maybe it’s true. But I can’t prove it. Try as I might, I could not get the virtual population to show such an effect.
So I returned to the tried and true method of having the chromosomes fine tuned to each other. Or maybe it’s mitochondrial DNA tuned to nuclear DNA. I don’t know. On the one hand I read that the two must be compatible. On the other hand I read that the nucleus from one species can be injected into the cell of another species and it works just fine. At all events, that is the model I came back to.
Since time had passed and desk top computers were even more capable, I was able to re-tweak the program to permit a bigger population and more offspring per couple. I finally got a set of numbers whereby I could 1. run a population for a thousand generations with a fixed maximum population size and a fixed set of assumptions of maximum offspring, mutation rates and impact of mutation rates 2. store the resulting population 3. pull the stored population back in with the same limit on size and the same other assumptions and have it reliably run another thousand generations, and 4. pull the same stored population back in with a much higher limit on population size and the other assumptions unchanged and have it die out reliably and 5. have the most likely time of extinction coincide with the end of the second cycle.
The effect was not as strong as it is seen to be in real life. The second cycle extinctions were only slightly more frequent than fist cycle extinctions and not much higher than later extinctions. But there seemed to be a preference for the second cycle.
So at the end of the day, the computer program does reflect the Chinese and Japanese experience and the Anasazi experience. The notch is not visible in other geographic locations. I believe that is because it is blurred out. So many regimes are dying at the end of their second cycle that the single cycle crisis is not visible.
However it may have visited us. The Great Depression was a time of lowered economic vitality for the developed world. It was also, particularly in the United States, a time of depressed birth rate. That was probably our first cycle crisis. The next time, unless we prevent the next time, things will probably not be as nice.
There have been 3,376 visitors so far.
Home page.


